how to use vscode debug elf ?
elf 是linux 下可执行可链接文件(executable and linkable format)。通过gcc/make 我们很容易编译出我们需要的elf文件,借助vscode可以在ubuntu图形化调试该程序,再也不用在gdb命令操作了。
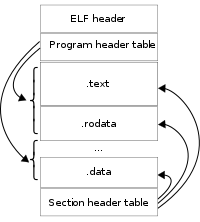
如下是elf文件结构,包含文件头(elf header)和代码、数据区索引表(program header table、section header table)和对应代码区、数据区。
明白了如上文件结构,还需要具体解答如下疑惑。
什么文件可以被调试?
通过
file命令对比可以知道用以调试的文件包含with debug_info。$file release_bin release_bin: ELF 64-bit LSB executable, x86-64, version 1 (SYSV), dynamically linked, interpreter /lib64/ld-linux-x86-64.so.2, BuildID[sha1]=b057c6d9ce31addd0db181d567845dbc1fe69013, for GNU/Linux 3.2.0, not stripped可以被调试的文件。
$file debug_bin
debug_bin: ELF 64-bit LSB executable, x86-64, version 1 (SYSV), dynamically linked, interpreter /lib64/ld-linux-x86-64.so.2, BuildID[sha1]=3c0501fa666e6fb8fdabad385772ed37053fca6f, for GNU/Linux 3.2.0, with debug_info, not stripped
debug 版本额外包含什么信息?
$readelf -a debug_bin |grep debug
  [30] .debug_aranges    PROGBITS         0000000000000000  000c1ba4
  [31] .debug_info       PROGBITS         0000000000000000  000c9e44
  [32] .debug_abbrev     PROGBITS         0000000000000000  0014b504
  [33] .debug_line       PROGBITS         0000000000000000  001591d9
  [34] .debug_str        PROGBITS         0000000000000000  001b50e3
  [35] .debug_ranges     PROGBITS         0000000000000000  00206cb0
  [36] .debug_macro      PROGBITS         0000000000000000  0020f540
如上可调式的elf文件中增加包含
debug_aranges、debug_info等7个section存储包含数组、文件信息、行数、字符串、宏等调试信息。可以通过
--debug-dump=aranges/info/abbrev/line/str/ranges/macro分别显示对应的 区信息。$readelf debug_bin --debug-dump=info|head -n 20 Contents of the .debug_info section: Compilation Unit @ offset 0x0: Length: 0x1027 (32-bit) Version: 4 Abbrev Offset: 0x0 Pointer Size: 8 <0><b>: Abbrev Number: 1 (DW_TAG_compile_unit) <c> DW_AT_producer : (indirect string, offset: 0x5537): GNU C99 9.2.1 20191008 -mtune=generic -march=x86-64 -g3 -O0 -std=gnu99 -ffunction-sections -fdata-sections -fcommon -fasynchronous-unwind-tables -fstack-protector-strong -fstack-clash-protection -fcf-protection <10> DW_AT_language : 12 (ANSI C99) <11> DW_AT_name : (indirect string, offset: 0x3ba4): app_main.c <15> DW_AT_comp_dir : (indirect string, offset: 0xd2c3): /home/lijie/my_project/debug_bin <19> DW_AT_ranges : 0x30 <1d> DW_AT_low_pc : 0x0 <25> DW_AT_stmt_list : 0x0 <29> DW_AT_GNU_macros : 0x0 <1><2d>: Abbrev Number: 2 (DW_TAG_base_type) <2e> DW_AT_byte_size : 1 <2f> DW_AT_encoding : 8 (unsigned char) <30> DW_AT_name : (indirect string, offset: 0x8fe1): unsigned char如何设置debug/release 版本?
知道了用以调试的程序信息,那么如何编译对应程序的debug版本,通常来说编gcc的
-gdebug 选项和-O优化选项:if DEBUG AM_CFLAGS = -g3 -O0 #调试的最高等级,优化的最低的等级; AM_CXXFLAGS = -g3 -O0 else AM_CFLAGS = -O2 #优化的的最高等级; AM_CXXFLAGS = -O2 endif
提示:如上命令参数详情可以参考3.10 Options for Debugging Your Program、3.11 Options That Control Optimization。
有了如上elf文件认识,接下来就是vscode debug程序了,成功编译可执行文件后,通过vscode 建立工程添加所有源文件。
Extensions(Ctrl+Shift+x)->添加c/c++ 插件(其包含用以调试的gdb);
Run(Ctrl+Shift+D)->create a launch.json file. ->C++ (GDB/LLDB),在自动生成的launch.json 找到program文件输入包含调试信息的elf文件路径即可。
提示:如下的program路径可以是绝对路径,也可以是相对于工程目录变量${workspaceFolder}的相对目录。
{
    // Use IntelliSense to learn about possible attributes.
    // Hover to view descriptions of existing attributes.
    // For more information, visit: https://go.microsoft.com/fwlink/?linkid=830387
    "version": "0.2.0",
    "configurations": [
        {
            "name": "(gdb) Launch",
            "type": "cppdbg",
            "request": "launch",
            "program": "${workspaceFolder}/debug_bin",
            "args": [],
            "stopAtEntry": false,
            "cwd": "${workspaceFolder}",
            "environment": [],
            "externalConsole": false,
            "MIMode": "gdb",
            "setupCommands": [
                {
                    "description": "Enable pretty-printing for gdb",
                    "text": "-enable-pretty-printing",
                    "ignoreFailures": true
                }
            ]
        }
    ]
}
成功配置该路径后保存后
Run(Ctrl+Shift+D)->选择(gdb)Launch,绿色按钮进程调试。
troubleshooting
cannot set breakpoint
Module containing this breakpoint has not yet loaded or the breakpoint address could not be obtained调试过程中不能设置断点,参考如上描述,编译该程序过程中增加-g3 -O0选项使能调试信息,禁止优化选项。
暂无评论